Mac OS X doesn’t surface system performance data in a way that works well for everyone. The built-in Activity Monitor provides some insight, but it’s more of a task viewer than a complete system analysis tool. When apps hang or fans kick into high gear, it leaves users guessing. A dedicated system monitor fills that gap by making resource usage visible, organized, and, more importantly, timely. Some are made for day-to-day observation, others for specific troubleshooting moments. Not every option does everything, but each has its strengths depending on how closely you need to watch your machine.
iStat Menus: Reliable, Non-Intrusive Monitoring
iStat Menus has become a go-to for many Mac users because of how it handles visibility without intruding on workflow. It lives in the menu bar and breaks down key data like CPU load, RAM consumption, disk read/write speeds, GPU activity, sensor temperatures, and network traffic. All of it updates in real time.
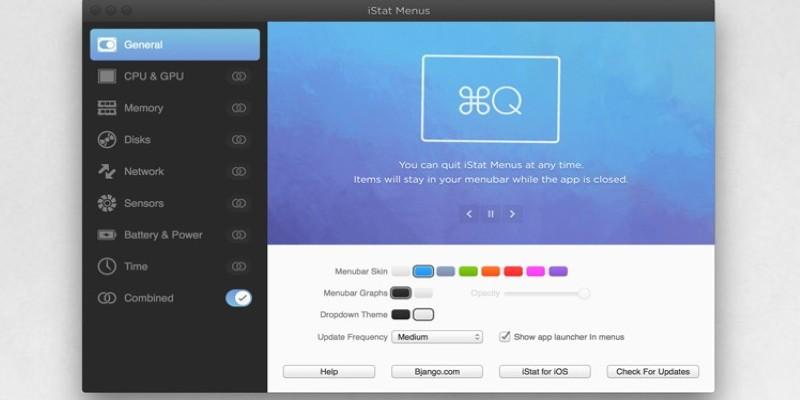
For example, someone managing Xcode builds, Docker containers, and a few browser windows might see their machine slow down. Instead of guessing whether it’s the container or a runaway script, a quick glance at iStat Menus reveals whether memory is maxed out or a particular core is under load. You can drill into historical graphs by hour, day, or week, which helps with patterns you wouldn’t catch otherwise—like overnight Time Machine backups dragging performance.
Its depth does come with a learning curve. Some of the graphs can be overwhelming, and there’s a fair bit of configuration involved if you want to avoid too much visual clutter. It also doesn’t focus on per-process detail the way some users might expect. But for persistent, clean monitoring that won’t interrupt your workflow, it’s hard to match.
Activity Monitor Plus: Better Data in Familiar Surroundings
Not everyone wants to install new software. For those preferring to stick with Apple’s built-in tools, Activity Monitor Plus adds some missing pieces without changing the layout. It’s a plug-in, not a full application, and it builds on top of what Activity Monitor already shows.
It adds GPU usage, fan speeds, and temperature readouts—features absent from the stock Activity Monitor. A video editor exporting from Final Cut Pro, for instance, might want to see if the GPU is hitting thermal limits. With this plugin, you don’t need to guess. You see how hard the graphics chip is working, whether thermal throttling is a concern, or if another background process is using unexpected resources.
It doesn’t include alerts, notifications, or system-wide tracking. The experience stays in the same Activity Monitor window, which can be a limitation if someone is looking for always-on stats or needs historical data. But for Mac users already used to the built-in monitor, this is a simple way to get a more complete view.
MenuMeters: Minimalist and Still Holding Up
MenuMeters isn’t new, and it hasn’t changed much since the days of Snow Leopard. That might sound like a drawback, but for many, it’s exactly the point. It gives live stats in the menu bar for CPU, memory, disk, and network usage. Each category has its own icon and minimal graph. There are no extra menus, popups, or background processes trying to guess what you want.

It works especially well for machines doing focused work over long sessions—say, an older Mac Mini handling audio routing or automation. MenuMeters shows when swap memory starts being used or when a background sync drags on, but it doesn’t interrupt. It’s fast, stable, and still functional even on macOS Ventura, though some features require manual security permissions due to system restrictions.
There’s no GPU tracking, no power data, and no per-application logs. It’s meant to stay small and do the basics right. For users looking to avoid bulky software or trying to keep older systems usable, it’s one of the few dependable tools that doesn’t try to be more than necessary.
AtMonitor: Aging Tool, Still Useful in Niche Setups
AtMonitor has mostly faded from the mainstream, but in specific workflows, it still gets pulled out. It’s a floating system monitor that gives detailed per-process stats, including thread count, CPU load by process, and custom filters. It doesn’t hide in the menu bar. It shows up as a translucent window that stays visible and can be positioned anywhere for continuous visibility across multiple desktops or displays.
This makes it ideal for benchmarking sessions or performance testing. A developer might run a Unity build while watching the load shift across CPU threads. Rather than guessing which subprocess is dragging things down, AtMonitor lays out every active process and gives clear load percentages next to each. It helps pinpoint misbehaving software fast with less time spent toggling between tools or waiting on laggy updates.
It doesn’t play well with newer macOS versions, though. Starting with Catalina, system permissions and hardware access make setup messy. It’s also no longer maintained. That means no updates for new chipsets, no bug fixes, and no support. Still, some users keep an old partition just for it because of how precisely it tracked performance on Intel-based Macs.
Conclusion
Each of these monitors solves a different type of problem. iStat Menus is ideal for long-term insight and clean, at-a-glance stats. Activity Monitor Plus suits users comfortable with Apple’s layout but wanting just a bit more. MenuMeters is the most lightweight and least demanding of them all. AtMonitor, while dated, serves a specific kind of performance diagnosis with surprising clarity. There’s no universal pick. It depends on how much you need to see, how often, and whether you want that data embedded in your workspace or only checked during a slowdown. Mac OS X doesn’t always make resource usage obvious. These tools return that visibility, each in its own way.